Third-Party Certifications, Gluten-free, Grain-free, Autism, Paleo Foundation, Local Supply Chains, Inclusive Hiring

The U.S. Food and Drug Administration (FDA) currently requires food manufacturers to list the total amount of carbohydrates within their food product; however, some manufacturers also list the total amount of “net carbohydrates” within the product in addition to the total amount. In this literature review, contextual information is given on the use of “net carbohydrates” within the nutrition literature and on food labels by manufacturers, a study conducted by the FDA on perceptions of such terms is reviewed, and a review of methods, both historical and modern, used to quantify net carbohydrates is given.
Third-Party Certifications, Gluten-free, Grain-free, Autism, Paleo Foundation, Local Supply Chains, Inclusive Hiring
The U.S. Food and Drug Administration (FDA) currently requires food manufacturers to list the total amount of carbohydrates within their food product; however, some manufacturers also list the total amount of “net carbohydrates” within the product in addition to the total amount. The term is currently unregulated by the FDA and thus, has no official meaning, however, many manufacturers have routinely listed it to refer to the total amount of carbohydrates within a food product that are not derived from fibers or sugar alcohols.
Their reasons for listing these quantities are complex, as are the methods used by manufacturers to calculate such quantities. In this literature review, contextual
information is given on the use of “net carbohydrates” within the nutrition literature and on food labels by manufacturers, a study conducted by the FDA on perceptions of such terms is reviewed, and a review of methods, both historical and modern, used to quantify net carbohydrates is given.
The U.S. Food and Drug Administration (FDA) currently requires that all food manufacturers accurately list the total amount of carbohydrates within a food product on the labels per the Fair Packaging and Labeling Act and the Nutrition and Education Labeling Act (NELA), the latter amended the previous Federal Food, Drug, and
Cosmetic Acid (FD&C) [1]. Thus, proper labeling of such quantities is mandated by federal law.
While all food manufacturers list such quantities on the food label, some manufacturers also list the total amount of “net carbs,” “impact carbs,” “effective carbs,” or “net effective carbs” of these foods (for the sake of consistency, we refer to them as “net carbohydrates” in this review). Because these phrases have no official definitions that are regulated by the FDA or U.S Department of Agriculture, it is difficult to claim that all variations refer to the same concept, but these terms have mostly been used by food manufacturers to relay to consumers the total amount of carbohydrates contained within the product that are not derived from sugar alcohols and/or fibers. Freeman & Hayes (2004) argue that manufacturers have often done so to appeal to the low-carbohydrate market [2]. They write,
“The intent of these claims is to convince consumers that the products are beneficial to a low-carb diet because with their minimal effect on blood glucose, increases in insulin levels and consequent weight gain will not occur.”
Despite the claims, there has largely been no evidence to substantiate them. A search for the phrase “net carbohydrates” on databases like PubMed, Scopus, and Web of Science will yield few results, many false positives (see the Appendix), but on generalized search engines like Google, will yield many non-academic results, with many listing unsupported claims attributed to net carbohydrates. Although many manufacturers don’t always explicitly make these claims, it is generally interpreted by many consumers that net carbohydrates are of general importance.
Indeed, an experimental study published by the FDA two years after Freeman & Hayes’s 2004 paper provides some insight into how consumers perceive these terms [3]. The FDA provides their motivation for conducting such a study which recruited participants using the internet,
“The universe for this study was U.S. adult members of a consumer opinion panel belonging to the research firm Synovate. The panel consisted of over 600,000 U.S. households that were recruited by a variety of means and agreed to participate in Internet research studies.
As an experimental study, this research was intended to help reveal causal relationships between label claims and consumer responses. The panel was not a nationally or locally representative sample and cannot be used to generate precise estimates of population parameters. The strength of the experimental study lies in its internal validity, on which meaningful estimates of differences across conditions can be produced.”
THE DESIGN AND ANALYSIS OF THE EXPERIMENTAL STUDY
More details about the study design and objectives are given: it was intended to evaluate the causal effect of varying carbohydrate food label claims and related label disclosure statements on consumer understanding (thus, it may be reasonable to assume that some sort of randomization was employed given the language, but no information on this is provided); the tested food label claims included:
The tested disclosures included statements such as:
The agency exposed one participant to only one product/label condition, therefore participants either saw a front panel with or without a carbohydrate food label claim, or a front panel with the corresponding Nutrition Facts label, which was provided side by side with the front panel. Figure 1 depicts the appearance of some of the labels.
After being exposed to the labels, the participants were given questions where they were asked to rate the food product shown to them on a series of Likert-based scales (in which the responses are ranked, ex: 7-point scales, with a score of 7 being the highest and 0 being the lowest) for the following categories:

In late 2005, they sent the mentioned 600,000 households screening questions in order to collect more information about their diet status. Approximately 173,000 households responded to their questions, roughly indicating a 29% response rate, relatively poor compared to some recent web-based recruiting efforts [4]. A total of 9,700 participants were included in the study, with a minimum of 180 participants per product and label condition.
Although lack of information in the reporting of a study design and analysis does not compromise the quality of a study in and of itself, almost no information is provided on the exact number of participants included in the study, their characteristics prior to entering the study, descriptive statistics about the prevalence of missing data and how they handled them, nor any more details about the causal estimand(s) of interest [5-8].
There is also no information given on what sort of randomization scheme was used, if any. This is not surprising given that the FDA is attempting to provide a summary on a general web page, however, the information is also not given by the FDA on any documents or separate web pages.
Little information is also provided on the analysis that was conducted on these collected data, apart from their reporting that means for the conditions by food product were compared and that a generalized linear model was employed. However, the FDA did provide information on covariate adjustment and the response variables used,
“The results from the experiment were analyzed using SAS software. The mean ratings on each outcome variable by product and condition were compared. Each outcome variable was also used as the dependent measure in Generalized Linear Models (GLM). The series of GLM evaluated the relationship between each outcome variable, the combination of the product and claim, and other variables that could affect respondent ratings.
These other independent variables in the models were whether the respondent was male or female, diabetic, on a low-carb diet, used the Nutrition Facts for first-time purchases, consumed products like the one in the experiment, the respondent’s age, the respondent’s income, and interactions between the product and the condition, age and diet status, and age and income.”
The use of covariate adjustment, which is rare given that most clinical trials only provide the unadjusted analyses in their report, in experimental studies offers many advantages, including increased statistical
power thus, a strength of this study in addition to the large sample size.
No tabulations or visualizations are provided when the FDA summarizes the results from their study analysis,
“The analysis showed that without the Nutrition Facts label available, respondents who saw claims that imply “low in carbohydrate” on the front of food packages had some positive associations with these products that may or may not be accurate. When the Nutrition Facts label was available side-by side with the front panel, respondents made appropriate product judgments when evaluating products with claims that imply either fewer or more carbohydrates.
Findings from GLM analyses:
Thus, from the currently available information, the agency summarizes that when consumers see a food labeling claim that implies that a food product is low in carbohydrates and helpful for weight management than those who were not exposed to such a claim, even if the information on the label were not accurate and even if disclosure statements were given on the product.
However, despite the findings, it is difficult to critically appraise the study by the FDA because the reporting of the design and analysis of the experiment is so deficient therefore, making it difficult to assess the strength and validity of the findings [5-8]. Further, the FDA does not provide any details or discussion on why the carbohydrate terms/claims “may or may not be accurate”. However, some of these issues have been discussed at length within the nutrition literature, which we review below, along with a discussion of why certain methods of quantification can be more misleading than others.
Historically, net carbohydrates have been quantified by subtracting the differences of “non-digestible” carbohydrates such as sugar alcohols and fibers from the total amount of carbohydrates within a food product to quantify the total amount of “non-fiber total carbohydrates”, or “net carbohydrates”. This approach (the “difference method”) often involves quantifying the components within the food product using ash data, in which the food product is often dried at high temperatures or oxidized, which is then used to quantify the components found within the product using the ash, with the term “ash” referring to “inorganic residue remaining after either ignition or complete oxidation of organic matter in a foodstuff.”
A number of different ash content analysis techniques exist such as dry ashing, wet ashing, mineral ashing, and plasma ashing.
Most involve analyzing the components using gravitometric or calorimetric methods. This is then typically used to derive the total amount of fibers, sugar alcohols, polydextroses, and fructans, which are then often subtracted from the total amount of non-protein, non-fat, and non-water content (assumed to be the total amount of carbohydrates within the product). Lilla et al. (2005) provide the following general formula for the difference method:
NET CARBOHYDRATES = (100-PROTEIN-FAT-WATER-ASH) – SUGAR ALCOHOLS – FIBER – POLYDEXTROSE – GLYCERIN – FRUCTAN
However, this approach has been argued as misleading for many reasons; not all sugar alcohols and fibers are equally resistant to digestion or equally bioavailable, yet the difference method generally treats them as such. For example, erythritol is a sugar alcohol that is well absorbed (relative to other sugar alcohols), however, very little of it is metabolized by the liver and much of it is excreted in the urine as is. Other sugar alcohols and fibers also vary in their digestibility, with some yielding some portion of carbohydrates that can be absorbed and metabolized by the body, posing an issue for the general claim that net carbohydrates (which does not include sugar alcohols) are the only quantities of concern for a consumer.
Recognizing these issues of imprecision and variability with the difference method (often using ash data), some researchers explored other techniques to quantify the amount of net carbohydrates within food products, with one of the earliest methods being gas chromatography. Chromatography is an analytical chemistry technique used to separate the components within a food product, purify them, and then quantify them, although there are also chromatography techniques used for non-analytic purposes such as preparatory chromatography, which are beyond the scope of this discussion.
The gas chromatography method, in particular, was a popular method for quantifying net carbohydrates in the 1970s [9], but quickly fell out of favor for many reasons; it often required strongly acidic cation exchange columns with metals often consisting of calcium, lead, and silver, which required extended analysis times; the test often showed poor performance/selectivity for higher oligosaccharides, specifically due to the detector that was used, a refractive index (RI) detector, which often suffered in performance at high temperatures.
Such high temperatures were necessary to obtain optimum performance by the strongly acidic cation column exchanges for carbohydrate separation, but the drawback was the RI detector suffered because retention of the carbohydrates often decreased as temperature increased, and this relationship was further mediated by the size of the carbohydrates being analyzed, for example, large polymers such as oligosaccharides suffered the most in retention thus, giving imprecise results with poor selectivity for the higher oligosaccharides.
Other techniques existed at the time such as the separation of carbohydrates using borate complexes, which was shown to be superior to the gas chromatography method, however, it was limited by the fact that the time necessary to produce the borate complexes was often quite long and made it highly inefficient. Another method used at the time involved using amino-bonded phasing with micro-particulate silica to separate the simple mono- and di-saccharides, however, there was difficulty with detecting the higher oligosaccharides, without requiring a very long analysis. In essence, it too was inefficient and was actually inferior to the borate-complex method.
Due to the limitations with these methods at the time, many food chemists/scientists developed a new method that used high-performance anion exchange (HPAEC) to separate the carbohydrates using strong bases with alkaline eluents, as opposed to the strongly acidic cations. Another difference from the commonly used gas chromatography method was that instead of using a refractive index detector, an electrochemical detector was used, specifically a pulse amperometric detector, often using gold as the electrode material. This was able to bypass some of the limitations imposed by the use of an RI detector.
This method (HPAEC) with a pulsed amperometric detector has shown considerable success with the separation and detection of carbohydrates, including higher oligosaccharides. The primary advantage is its use of a lower column temperature (with temperatures ranging between 20 and 45 degrees Celsius being used for optimum performance) and eluent strength, which influences the retention time and order of the separated mixtures. Furthermore, it was found that the selectivity for higher oligosaccharides, which were difficult to detect with the RI detector used in gas chromatography method, were primarily influenced by the amount hydroxide ion concentration, with optimum selectivity shown for 0.150 M NaOH for higher oligosaccharides and column performance increasing with the amount of hydroxide ion concentration increasing.
Some researchers [10] have tested whether digesting the complex polymers using enzymes into simple monosaccharides prior to the use of HPAEC and pulse amperometry would impact the analysis and recovery of the amount of carbohydrates (often quantified using quadratic regression and the formula:
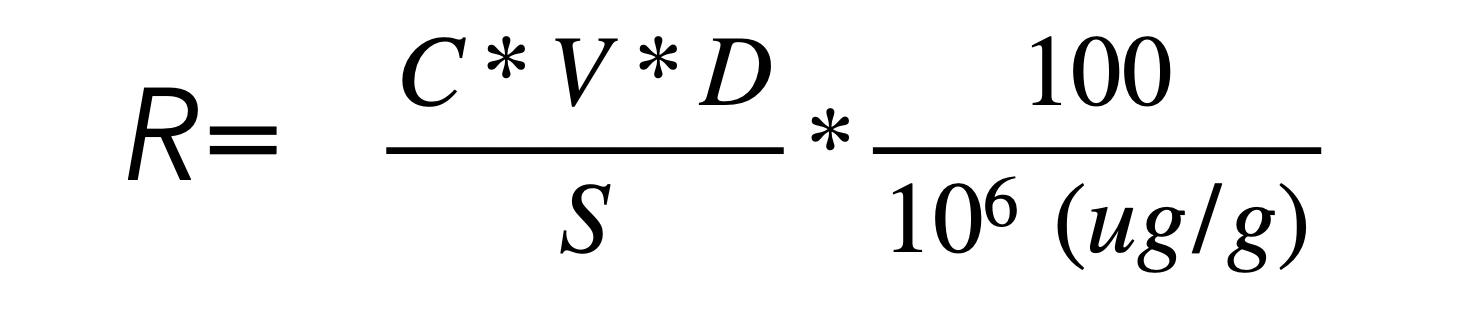
However, no such difference has been shown between the use of such enzymes and the absence of such enzymes. Although such an analysis failed to show a difference, what it did show was that HPAEC was a consistent method, showing similar recovery numbers after repeated testing for validity of the methods and eluents used. Thus, rather than use the difference method using ash data, the most reliable method to quantify the amount of carbohydrates in a product seems to be to use the HPAEC method with pulse ampometry.
The use of the term “net carbohydrates” is accompanied by much controversy for several reasons many of which are regarding the accuracy of the claims attributed to the reduction of net carbohydrates. There is little evidence to support many of the beneficial claims, however, experimental research conducted by the FDA possibly suggests that they may lead consumers to believe that a product is lower in carbohydrates and also helpful for weight management, although the usefulness of these findings is also severely limited by deficient reporting of the design and analysis. More research into the phenomenon of net carbohydrates, along with procedures to quantify them, and research into whether any claims of them are valid is necessary.
A search of the phrase “net carbohydrates” on PubMed on September 18, 2020 yielded 17,004 results and 3,143 results on Web of Science. However, because the search query was not very specific, it is highly likely that a large portion of these results would be false positives. Indeed, random checks on many of the queries seems to support this. Thus, a more systematic and specific search was conducted using the following search query: “(((((net carbohydrate* [tw]) OR effective carbohydrate* [tw]) OR effective carb*[tw]) OR net effective carbohydrate* [tw]) OR net effective carb* [tw])”, which provided 390 results. We examined these results to assess any evidence of the claims attributed to the reduction of net carbohydrates, which we discuss in the review.
1. U.S. Food and Drug Administration. Guidance for Industry: Food Labeling Guide. U.S. Food and Drug Administration. 2013. https://www.fda.gov/regulatory-information/search-fda-guidance-documents/guidance-industry-food-labeling-guide.
2. Freeman J, Hayes C. “Low-Carbohydrate” Food Facts and Fallacies. Diabetes Spectr. 2004;17:137–40.
3. U.S. Food and Drug Administration. Experimental Study of Carbohydrate Claims on Food Packages Analysis Report. U.S. Food and Drug Administration. 2006. .
4. Karlsen MC, Lichtenstein AH, Economos CD, Folta SC, Rogers G, Jacques PF, et al. Web-Based Recruitment and Survey Methodology to Maximize Response Rates from Followers of Popular Diets: the Adhering to Dietary Approaches for Personal Taste (ADAPT) Feasibility Survey. Curr Dev Nutr. 2018;2. doi:10/ghchr4
5. Moher D, Hopewell S, Schulz KF, Montori V, Gøtzsche PC, Devereaux PJ, et al. CONSORT 2010 Explanation and Elaboration: updated guidelines for reporting parallel group randomised trials. The BMJ. 2010;340. doi:10/dk436j.
6. Schulz KF, Altman DG, Moher D, the CONSORT Group. CONSORT 2010 Statement: updated guidelines for reporting parallel group randomised trials. BMC Med. 2010;8:18.
7. Hayati Rezvan P, Lee KJ, Simpson JA. The rise of multiple imputation: a review of the reporting and implementation of the method in medical research. BMC Med Res Methodol. 2015;15:30.
8. U.S. Food and Drug Administration. Clinical Trials Guidance Documents. U.S. Food and Drug Administration. 2020. https://www.fda.gov/regulatory-information/search-fda-guidance-documents/clinical-trials-guidance-documents.
9. Rocklin RD, Pohl CA. Determination of Carbohydrates by Anion Exchange Chromatography with Pulsed Amperometric Detection. J Liq Chromatogr. 1983;6:1577–90.
10. Lilla Z, Sullivan D, Ellefson W, Welton K, Crowley R. Determination of “net carbohydrates” using high-performance anion exchange chromatography. J AOAC Int. 2005;88:714–9.
This work is licensed under a Creative Commons Attribution 4.0 International License.
 High Variability in Glycemic Index Values Leads to Low Practical Utility
 Natural Force: Third Party Certifications and a Remote Workforce
